About Greyson Clothiers
Greyson Clothiers operates a direct-to-consumer business model, offering high-quality, fashion-forward apparel that blends timeless style with modern trends. Known for redefining golf and tennis fashion, Greyson combines meticulous craftsmanship with innovative design to create a versatile collection that resonates beyond sports. By focusing on e-commerce and fostering a loyal community of customers, the brand has created a great shopping experience to drive growth and impact.
Goal: Improving the digital storefront user experience
Greyson’s CRO team recognized that conversion optimization and usability go hand-in-hand. Their philosophy was simple: if customers can navigate the site with ease, they’re more likely to find what they need and ultimately make a purchase. For a brand focused on inclusivity and quality, improving the digital storefront meant understanding the nuances of user behavior and leveraging that knowledge to create a truly seamless experience.
Observations: Understanding user behavior using Tight Leads Insights
To dig deep into what their users were doing—and why—Greyson turned to Tight Leads Insights.
After launching new features or pages, they use Heatmaps and Scrollmaps to determine what elements capture user attention, making prominent features even more accessible or removing underused ones.
Session Recordings provide a closer look at user navigation friction, allowing the team to address common issues and create a smoother, more intuitive shopping experience.
They have used Tight Leads Insights to:
- Determine optimal page lengths by looking at scrollmaps
- See which CTAs are getting clicks by observing heatmaps
- See where users are dropping off their site by using funnels; and
- Get a deeper look at specific user segment sessions by viewing recordings.
The team has hypothesized about page length, CTA clicks, filter clicks, color swatch clicks, navigation engagement, and more which they have been able to view and test using Tight Leads Insights and Tight Leads Testing.
Let’s look at two cases in particular to understand better how the team makes use of user behavior insights.
Case Point 1: Optimizing collection page filters
The challenge identified
Greyson’s collection pages offered filters, but were they truly helping customers find what they wanted?
Insight and action
Heatmaps showed heavy filter interaction, signaling that users relied on these tools to refine their searches. The team introduced more visually prominent filters to highlight top-clicked categories. Then, they put their hypothesis to the test through A/B testing in Tight Leads. Removing the new filters dropped page engagement by 5.3% and revenue by a significant 10.5%, confirming that the enhanced filters weren’t just window dressing—they actively supported user goals and sales.
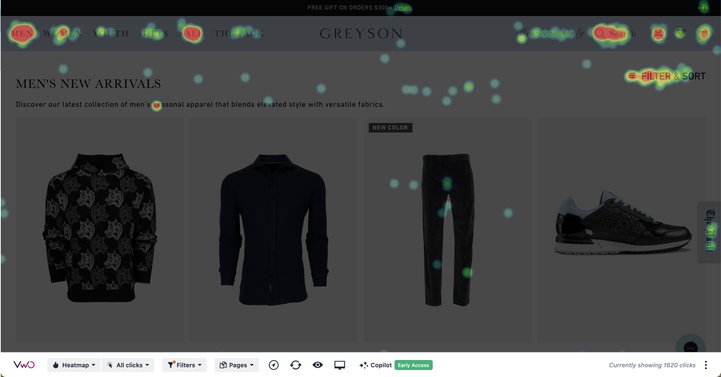
Product collection page heatmap report showcasing heavy interaction on filters
The new visual filters highlighted the most clicked options, helping direct users to the results they sought most often.
To evaluate the effectiveness of these visual filters, the team conducted an A/B test using Tight Leads.
Result
The results were clear: removing the visual filters led to a 5.3% drop in page engagement and a significant 10.5% decline in revenue. This confirmed the value of visual filters in improving user engagement and supporting shopping journeys.
Case Point 2: Making user interaction with CTAs easier
The challenge identified
During their regular operations touch base meetings, the CRO team at Greyson Clothiers noticed a concerning trend: an increase in bounce rates and a high number of dead clicks, particularly on mobile devices.
Insight and action
Upon closer inspection using session recordings in Tight Leads Insights, they discovered users struggled to identify clickable fields. Heatmaps and clickmaps further revealed that users were clicking on broader fields around elements rather than the call-to-action (CTA) buttons within them.
Based on these insights, the team hypothesized that the CTAs were neither clear nor large enough for effective mobile usability.
Result
They expanded the clickable area of modules, making it easier for users to interact with the site and thereby reducing bounce rates.
Results and learnings from user behavior analysis
- Increased user engagement and revenue through optimized visual filters.
- Improved navigation and reduction in bounce rates through enhanced mobile usability.
- Data-driven hypotheses leading to effective A/B testing, further refining user journeys